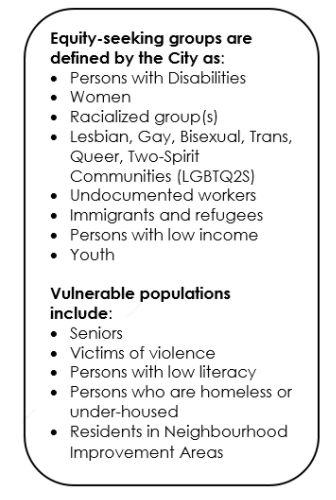
Cities across North America are working to integrate equity analysis into all workflows. The City of Toronto, for example, now requires an “Equity Impact Statement” for all major policies and reports to City Council, and is applying an Equity Lens tool throughout departments to identify and remove barriers for the City’s most marginalized and vulnerable communities. In 2015, Oakland’s City Council created a Department of Race and Equity (DRE) and developed a citywide equity strategy. Our data platform, Remix Explore, provides data capabilities that make answering questions about equity easy to explore, and meets the needs of teams looking to integrate equity across all they do.

City of Toronto's Equity, Diversity, and Human Rights (EDHR) team is developing strategies and identifying current and emerging equity-related issues.
Community Insights in an Instant
Remix makes exploring demographic data and the disproportionate impact of transportation projects as simple as three clicks of a mouse. Whether working on a Title VI outreach plan, writing a grant application, or drafting an equity impact statement, understanding the demographics of your community is so essential to planning that it should not be a painful, complex, time-intensive process. Remix’s recently launched Breakdown Tables allow you to instantly answer complex questions about race, poverty, housing, education, commute modes and more. Planners can save many precious hours refining grant applications, building responsive outreach plans, and determining potential impacts of infrastructure investments.
The Cost of Census
Historically, asking teams to integrate equity into all they do required expertise, technical know-how, and an intimate understanding of the intricacies of Census data. The traditional process takes several hours for each Census query. In our last webinar, our Data Analytics & Visualization Manager walked you through the costs of using Census.org to meet the needs of equity workflows. Check out her example workflow for context.
Using Breakdown Tables on Your Projects
Remix Explore demographic stats tools are already finding their way into the workflow of our customers. Janíce Soriano Ramos, a Senior Planner with Santa Clara Valley Transportation Authority (VTA) has been using Stats Grab to identify her community’s transportation challenges as part of their annual transit plan process. Transit Planner Lourdes Alvarez has integrated these tools into her Title VI training materials at Foothill Transit.
Breakdown Tables allow users to ask complex questions, adding a richness and discoverability that would have been hidden in the depths of Census accessed only by those who know how to navigate the system. Democratizing the power to explore equity questions with data will help shape stronger and more pertinent equity goals and programs for your community.

.png?width=71&height=47&name=Sioux%20Falls%20Webinar%20(6).png)


