Traffic volumes may be down by up to 50% in San Francisco, Salt Lake City, and Madison, but experts warn we’re about to bounce back and feel the burn.
Forebodingly referred to as “The Rebound” by four research experts at Vanderbilt University, the period of intense traffic congestion expected after cities lift restrictions could result in hundreds of dollars in annual expenses for every driver, and millions of dollars for every city.
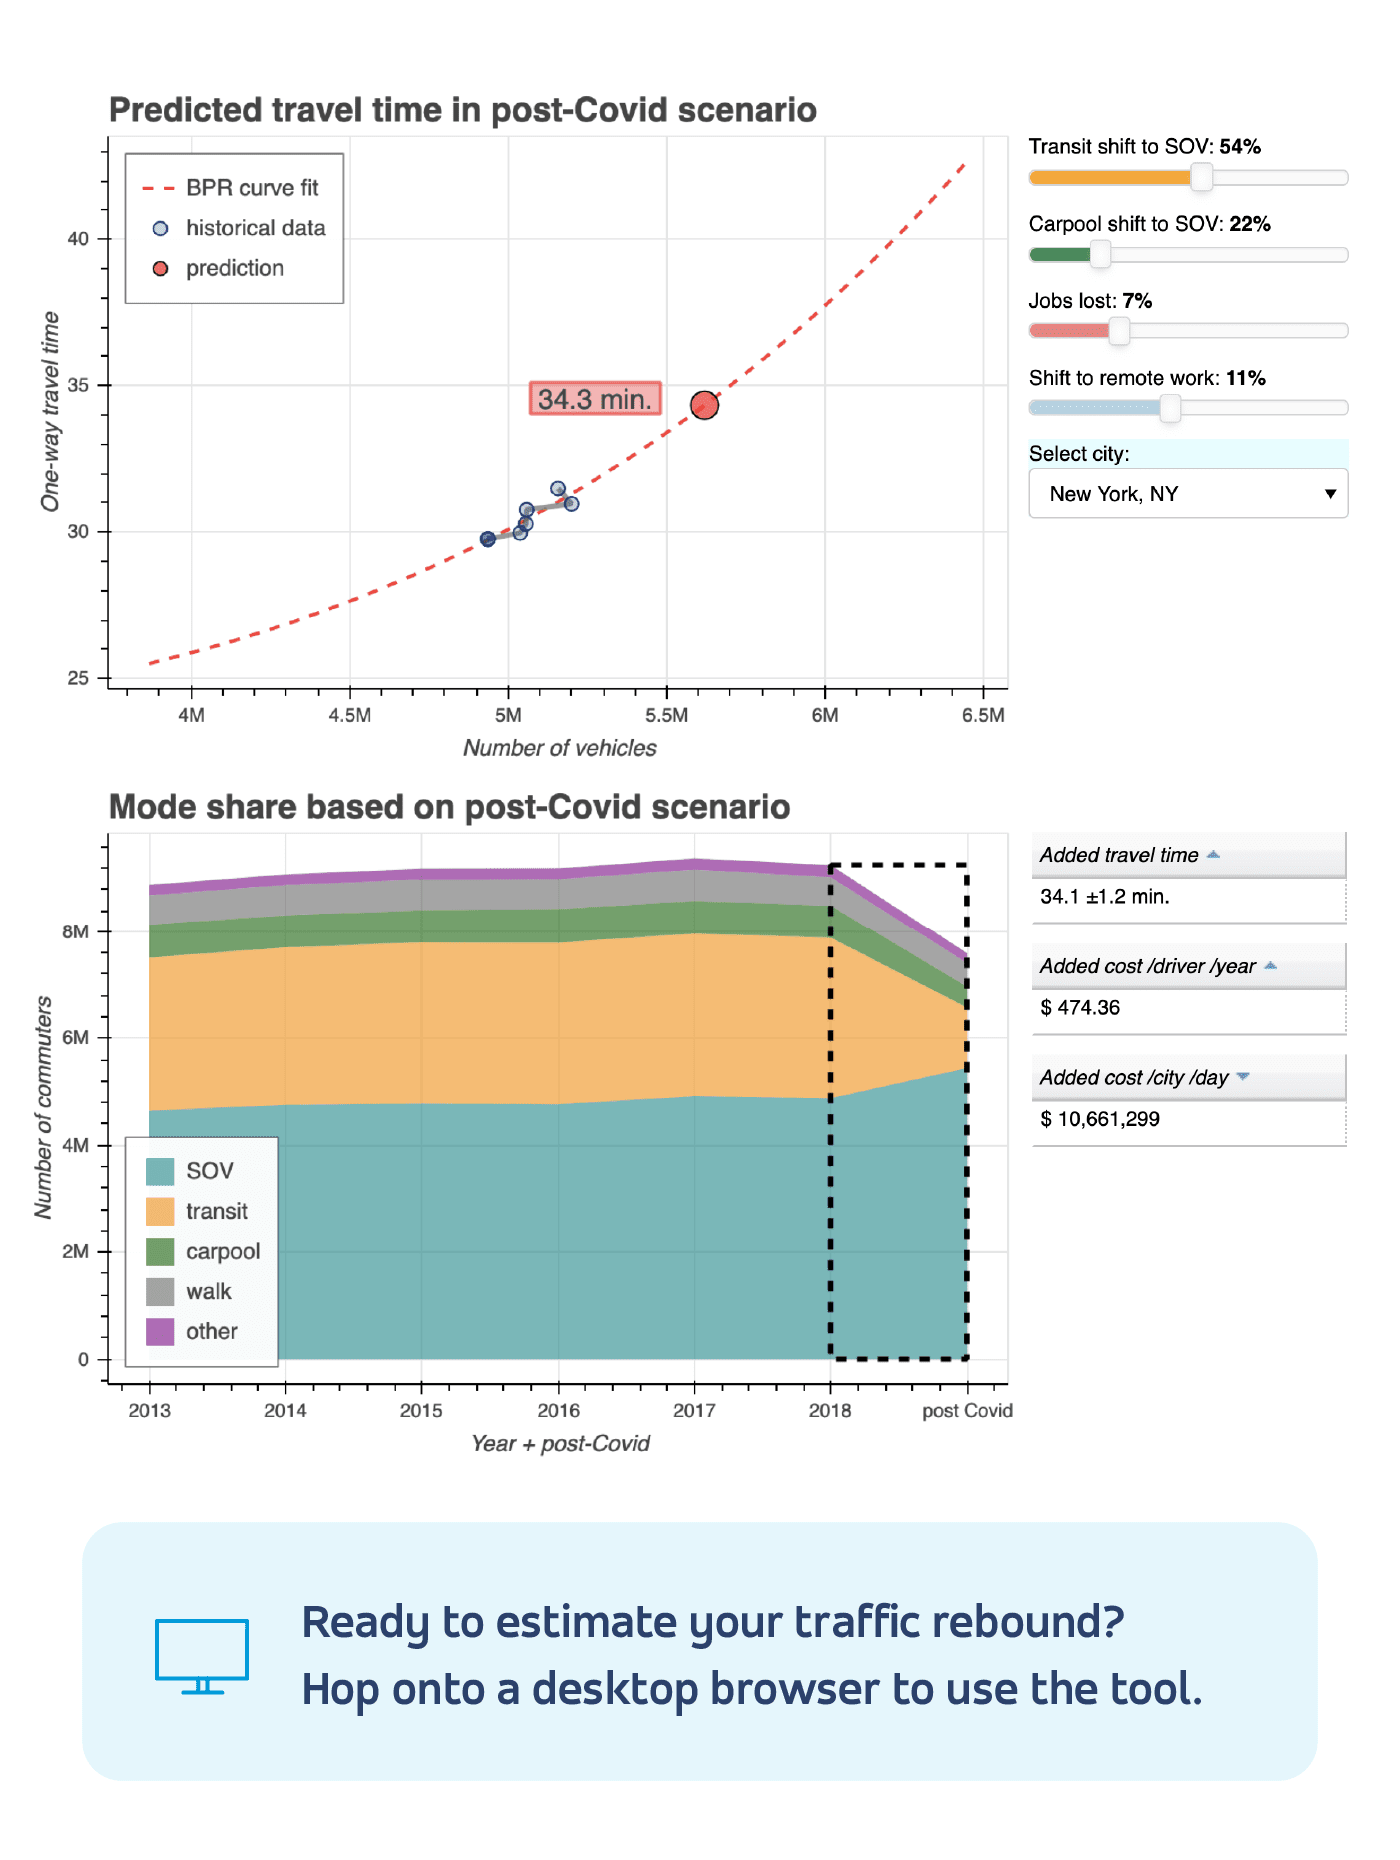
Enter The Rebound Calculator, a compilation of the Vanderbilt team’s comprehensive research on historical traffic data, vehicle capacity per city, public transportation use, and time spent commuting in each U.S. metro area. The experts behind the tool say it can safely estimate how a mode shift from public transportation or carpooling to single-occupancy vehicles will result in ballooning traffic and maddening gridlock that impacts both the driver and the city’s budgets.
“COVID-19 cleared the streets in many communities, but as we reopen, traffic will eventually rebound,” said Vanderbilt University Research Scientist William Barbour. “If transit ridership does not return, travel times will increase, sometimes dramatically. Travel time increases of 5-10 minutes (one-way) are possible in high-transit cities, which adds up to hundreds of thousands of hours of additional travel time each day. These increases are avoidable, if transit ridership resumes in step with car traffic.”
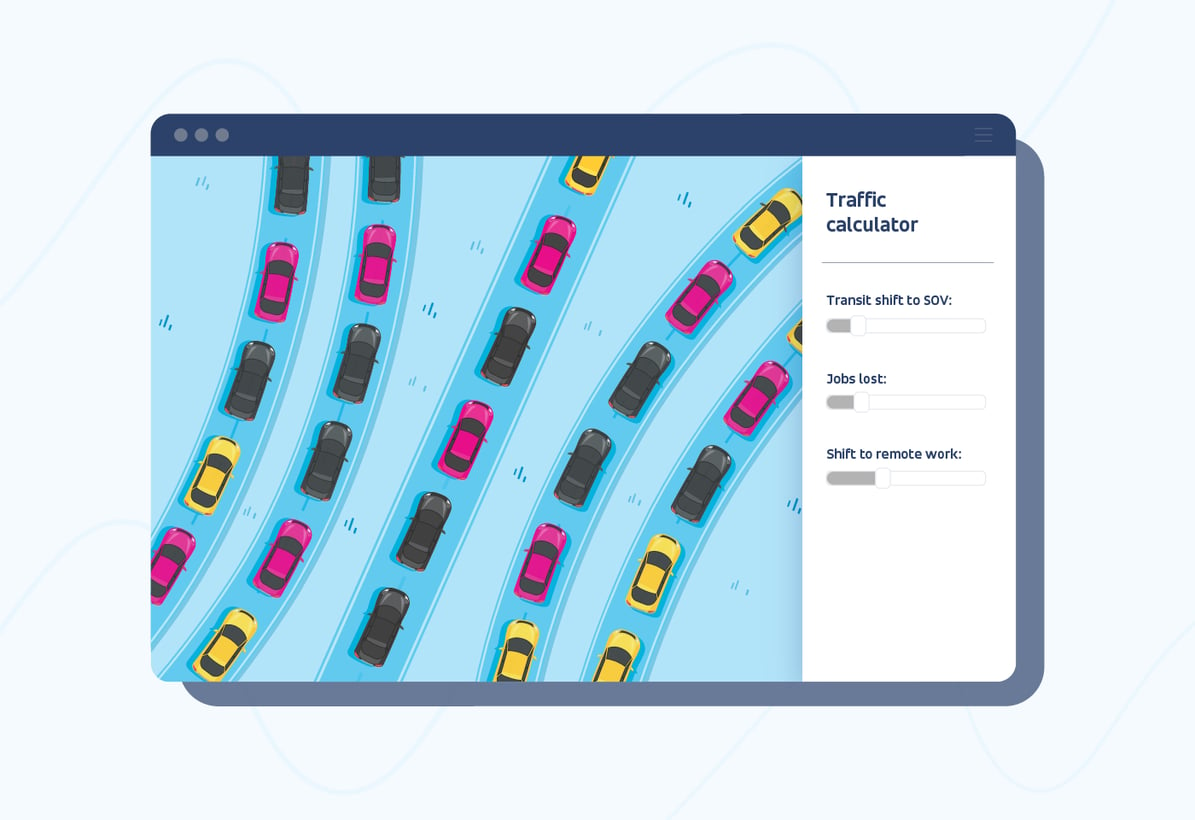
Want to see how your city might be impacted? First, select a city using the drop down menu in the calculator. Here’s how the tool works:
- Transit shift to SOV: Use this slider to see the impact of public transit users who may shift to driving a single-occupancy vehicle (SOV).
- Carpool shift to SOV: Use this slider to see the impact of carpoolers who may shift to driving a single-occupancy vehicle.
- Jobs lost: This is the percent of commuters who no longer travel to work because they are unemployed, eliminating their commute and reducing congestion.
- Shift to remote work: This is the percent of commuters who no longer travel to work because they are working from home.
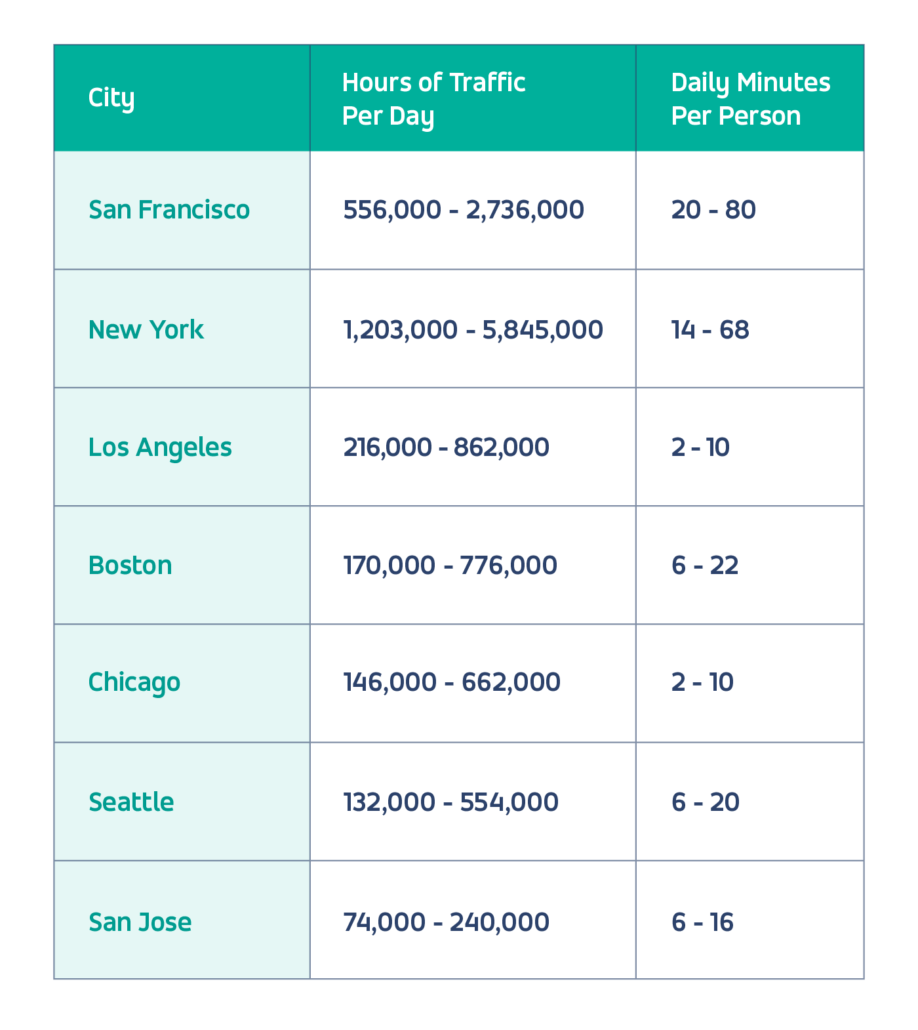
Barbour says that cities dependent on mass transit are most at risk for extreme traffic unless public transportation systems can resume safe, high-throughput operations quickly. Assuming there’s a 25% mode shift from transit and carpool to SOV, daily commutes in the following cities could swell to new levels:
 For more details about how the calculator was created, the researchers’ full methodology, and even more graphs and calculators to play with, see Vanderbilt University’s breakdown on GitHub.


.png?width=71&height=47&name=Sioux%20Falls%20Webinar%20(6).png)