
Congratulations! You just launched a new microtransit service. You spent months (or years) designing the service, gaining board and city council approval, securing a grant for the program, and choosing the right software or operational partner. After investing significant time and funding into a new service, you now need to make sure that it’s having the impact you intended. Keeping your overall goals in mind, you also need insights that meet all your reporting needs, including helping you optimize service operations, understand how and when to expand it, and compel stakeholders to continue to fund it in future years. All of this in addition to meeting your reporting obligations.
Without the right data, tackling these steps can be nearly impossible. But when you have access to the right data (and guidance on how to interpret and act on it), you can build a truly modern transit service — one that is continually optimized based on real-time data, and is flexible enough to evolve with your agency’s resources and goals.
A reporting suite built by operators, for operators.
Our operational experience, along with input from hundreds of agencies, have helped us build an analytics suite that enables you to run a successful service. The Via Operations Center (VOC) offers intuitive and user-friendly tools to aggregate, filter, and download data quickly, making service management and operations more dynamic and continuously optimizable.
Empowering you to course correct efficiently when needed.
Via’s reporting suite helps our partners optimize the performance of their services and make smarter planning decisions for the future. For example, easy access to service data helped a major urban microtransit service quickly identify that despite a big marketing push, ridership was much lower than anticipated shortly after launch. They then worked closely with the Via team to analyze all available data, to identify opportunities to increase ridership. From that analysis, the teams concluded that the current service zone was too small and should be expanded to include additional key destinations. Within 3 months of launching a larger zone, ridership increased by 6x, while operating costs remained the same. Data showed that rider satisfaction remained the same, even as existing vehicles were serving a larger service area.
Now, let’s break down the different reporting features that save your team time and inform the best possible planning decisions:
Understand service health at a glance with the KPI Dashboard.
The Service KPI Dashboard is your service analysis and management home base.. It consists of more than a dozen visual dashboards that display the most critical information about your service in easy-to-understand, presentation-ready charts. The KPI Dashboard is fully customizable with filters that help you understand trends across hours, days, weeks, months, or years. For example, you are able to review an hourly report of how well you’re meeting demand throughout the day, which would identify opportunities to increase or decrease vehicle supply to improve the efficiency of your service.
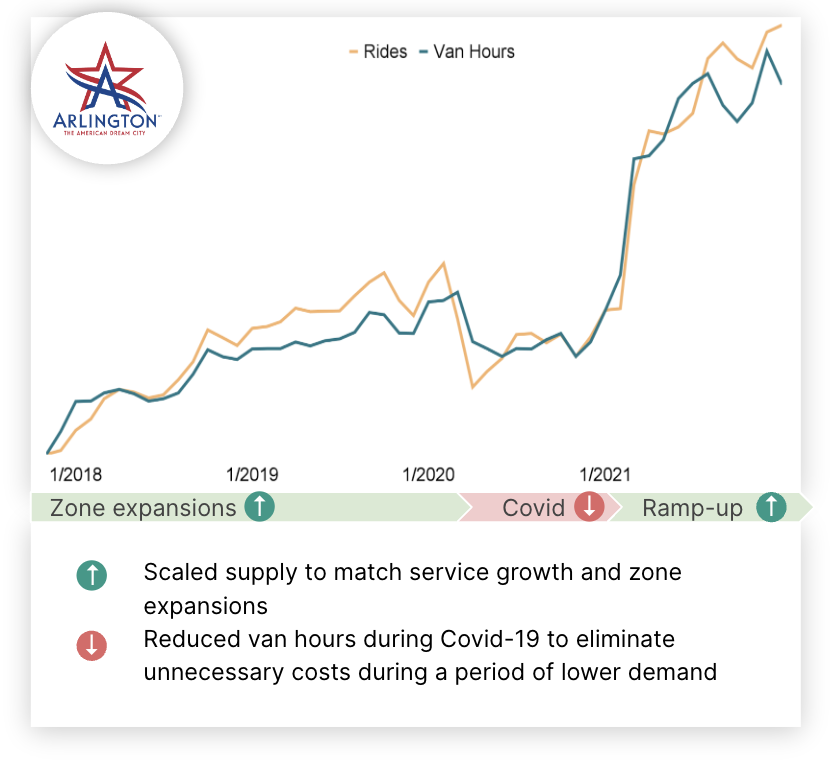
 Access to real-time, hourly operational data allowed the City of Arlington to identify opportunities to scale vehicle hours up or down according to fluctuating demand.
Dive deep into the raw data with the Data Generator.
While charts are a useful way to review your service performance at-a-glance, the Data Generator allows you to review raw data tables that have been tailored to your exact specifications. It serves up additional data — like rider and driver activity, ride pricing and payments, vehicle details, driver shift information, and more — so you can conduct more granular, specific analyses. You can also download the data in your preferred format and upload it to internal business intelligence tools to keep your stakeholders up to date. This means that as you’re deciding whether to increase your vehicle and driver supply, you can see exact details about the requests not being met during those peak hours. This level of detail can help you forecast both the cost and revenue associated with the supply adjustment, and how many and what type of additional vehicles and drivers would be needed to serve the additional rides.
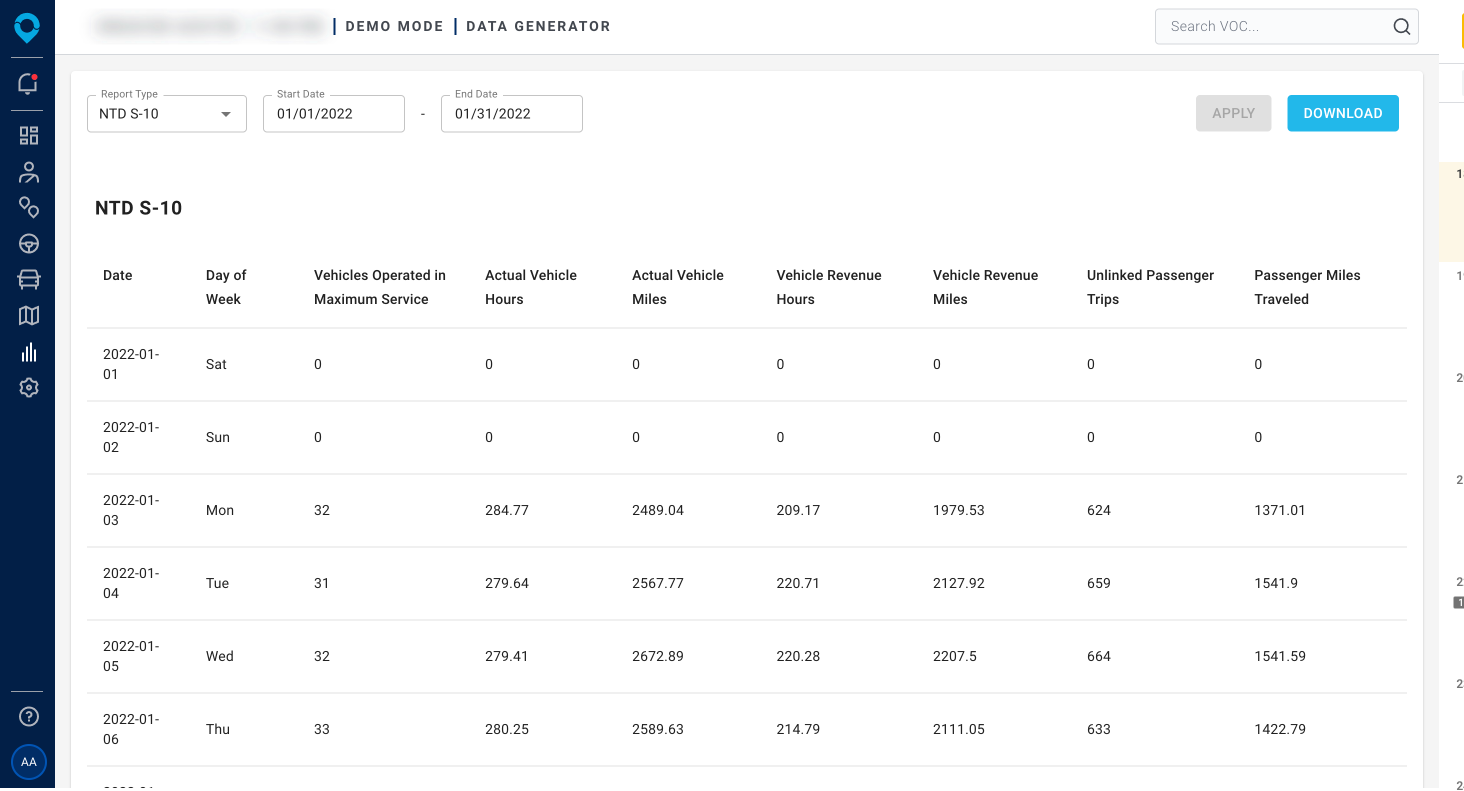
Easily meet your FTA obligations with NTD ready S-10 Reporting.
For US customers, the VOC also includes National Transit Database (NTD) reporting capabilities. Our vast experience working with federal transit funding recipients has helped us design dashboards that auto-generate all the required data fields for the S-10 report, saving your team time they previously spent on manual report compilation and ensuring you meet your reporting obligations. Any operational changes you make will be automatically, and accurately, captured so you can easily share the details with the NTD.
 Access to accurate, automatically generated S-10 reports ensures you remain compliant, while giving your staff time back to focus on running an efficient and high-quality service.
Keep stakeholders engaged and informed with turnkey reports.
Access to ready-to-present reports in the VOC also helps you keep your stakeholders informed of progress towards your goals. The regularly updated reports empower you to showcase your team’s successes and help you advocate for continued support for the service. For example, Mountain Line can pair weekly ridership and utilization reports with driver hours reports over the same period to demonstrate how they’re using agency funding more efficiently in recent months.
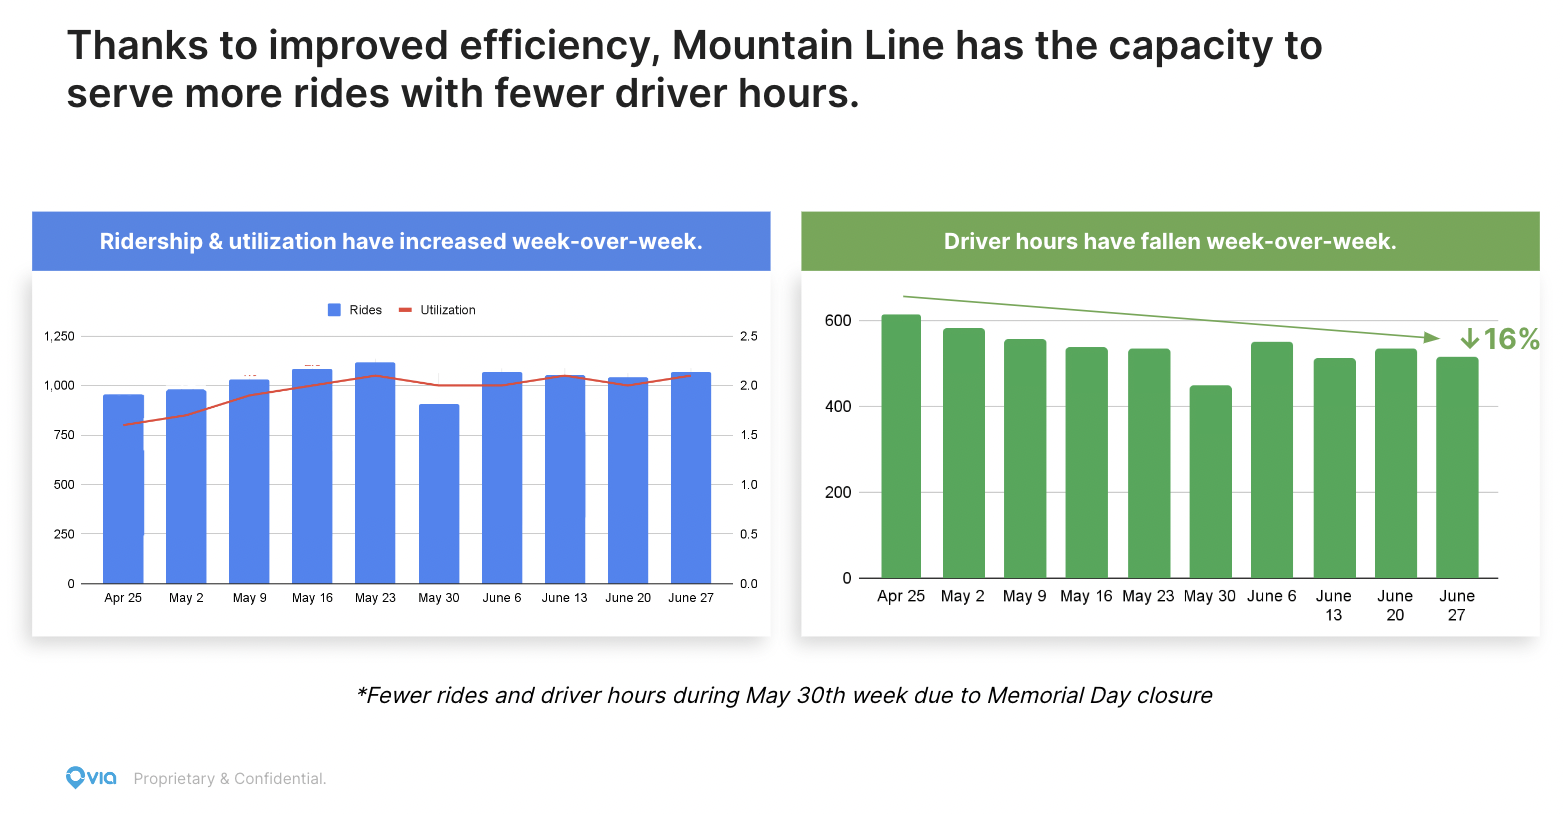
Access to data on ridership, utilization, and driver hours helped Mountain Line demonstrate increased service efficiency week-over-week that meant they were serving more riders with fewer rider hours.
Strong real-time data can be critical in transit operations — it helps you optimize service efficiency, understand and react to riders’ needs, and identify opportunities to expand your service. With a reporting suite designed with input from hundreds of transit agencies throughout the world, you’ll have the data you need at your fingertips, allowing you to make smarter service planning decisions.
Interested in learning more? Find time to talk with our team.


.png?width=71&height=47&name=Sioux%20Falls%20Webinar%20(6).png)
