
Welcome to our Data-Driven Planning Lessons series, where we give you key takeaways on how cities are increasing transit accessibility by leveraging multiple types of data, including demographics, fixed-route ridership, on-demand mobility patterns, and beyond — all in one platform. Let’s get started.
The small city of Wilson, North Carolina — with a population of just under 50,000 — confronted a mobility challenge: due to a lack of rider density, there were a low number of fixed-route buses on the road, leading to long headways. Facing an inconvenient schedule, residents with private cars chose to drive. But for the 12% of car-free residents, driving is not an option. Though Wilson had a relatively sprawling fixed-route network, it wasn’t working optimally for many of the residents who needed it most.
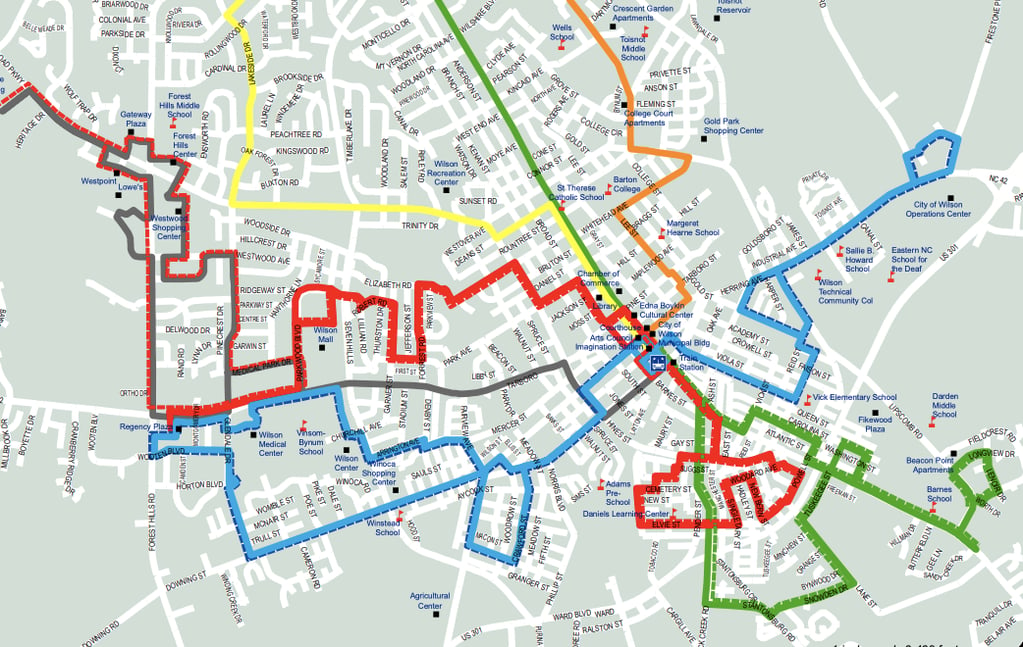 Despite the sprawling network, its inefficient fixed routes and inconvenient schedules resulted in hour-long headways. Wilson, North Carolina. Source: wilsonnc.org
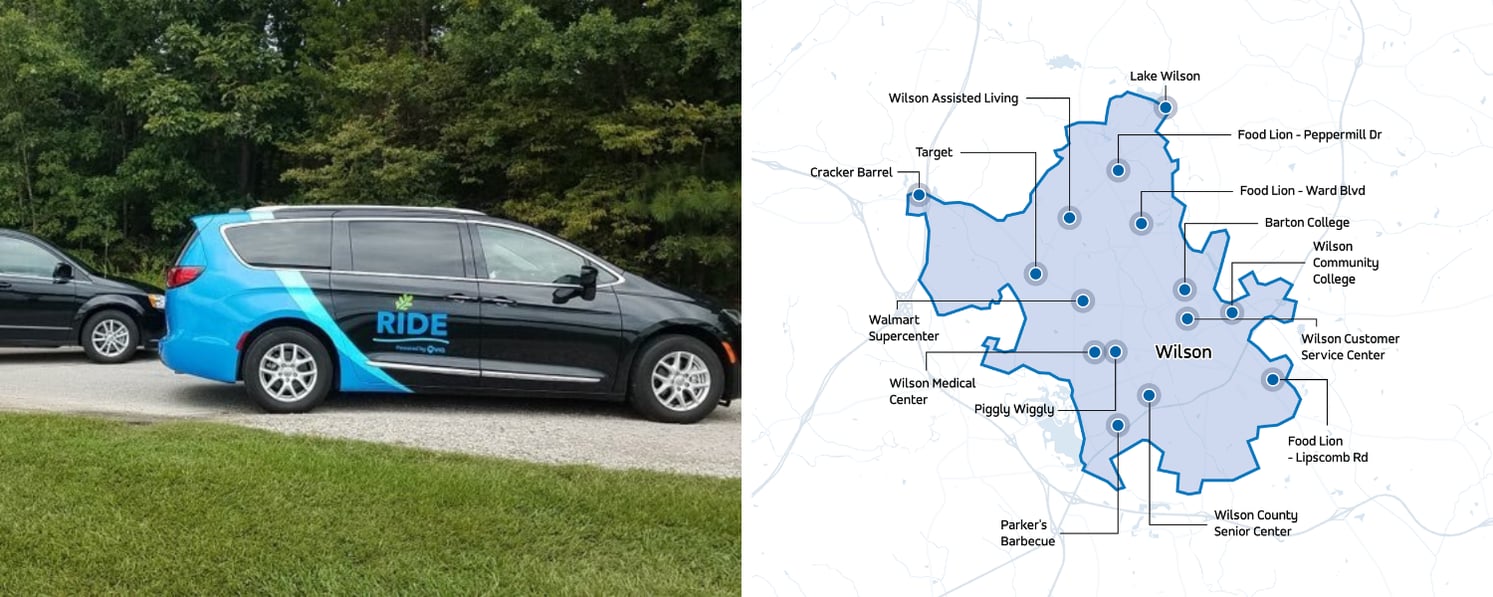
When the COVID-19 pandemic drove ridership even lower, the City looked for a more efficient solution to help riders reach essential destinations safely and quickly, without long waits or transfers. In September 2020, the City launched its on-demand transit service, RIDE, which completely replaced Wilson’s fixed routes and expanded coverage to areas the previous system didn’t reach (the zone borders are visualized in Remix below). Even better, the Remix-visualized on-demand ride data shows that demand has been concentrated in areas of the city where car-free rates are especially high, demonstrating that the service is filling a real gap in transportation access for Wilson residents.
Drag the centerline in the slider below to see how on-demand rides are serving areas of the city where car-free rates are especially high.
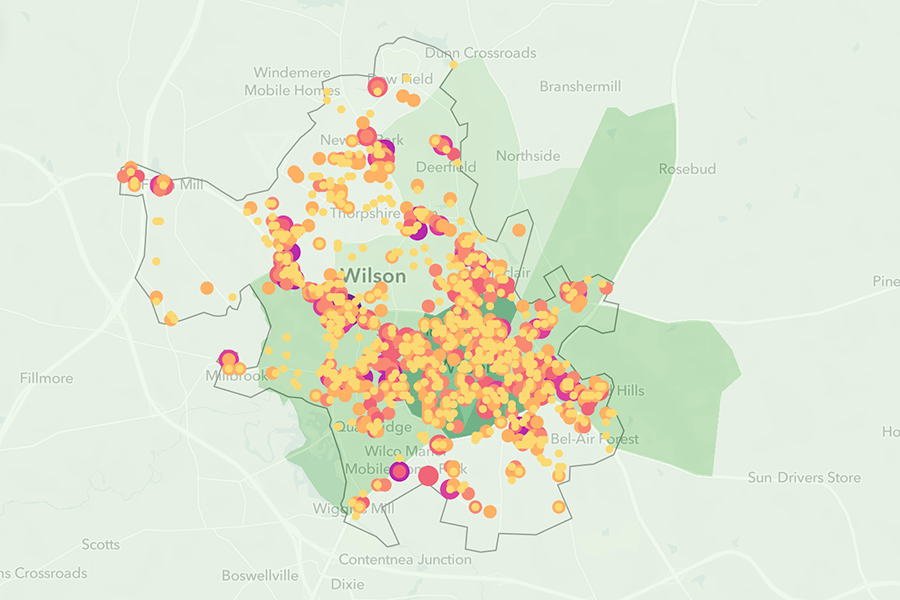
Demographics data and on-demand rides distribution visualized in Remix, showing that a majority of rides started or ended in communities with high car-free households density.
Rodger Lentz, the city’s Chief Planning and Development Officer, thinks microtransit is the answer for car-oriented rural areas across the country. “We were able then to take the same resources that we had for fixed routes and cover an entire city. Now [we’re] connecting people to jobs that were out of reach for them.”
Indeed, 50% of riders reported that the service had helped them gain or maintain employment. For the 16% of riders who have a physical or mental disability, RIDE has become their lifeline to seek care. And more Wilson residents are taking transit than ever before: RIDE ridership quickly reached 140% of the legacy fixed-route ridership, even as the pandemic raged on. And with the budget holding steady, the more efficient microtransit service saw a cost-per-trip reduction of 38%.
One of the biggest challenges of service planning is justifying proposed service changes to the city council and local residents. Remix’s integration of demographic statistics could help show the bigger picture of community impact on the map as it is created. Transit planners can easily draw a service zone, and have all the census data related to transit equity automatically added there. Even after the service launch, Remix can still track the performance of the on-demand programs, showing ridership distribution, popular destinations, and the demographics of service zones. Planners can even upload other much-needed data layers like new rider sign-up information for service expansion purposes.
This article is one of a series of transit planning stories featuring how cities are transforming transit deserts with a new solution:- Cities are transforming transit deserts with data-driven planning
- The key to successful transit planning: complement fixed routes
- In transit planning, on-demand is essential for low-density cities
- Filling the gaps in areas with limited or no transit options
- Microtransit fills in transit gaps to link this suburb to broader opportunities


.png?width=71&height=47&name=Sioux%20Falls%20Webinar%20(6).png)
