
Washington-based agency King County Metro (KCM) recently launched the South Link Connections Project in partnership with Sound Transit—a major redesign charged with improving transit access in the southern counties. The project announced a significant light rail extension, adding several new stations to connect South and North King County.

“This project is a chance to improve transit connections for people in South King County by using bus service to connect riders to regional light rail service.”
— Melissa Gaughan, Senior Business Analyst, KCM
For KCM this presented a rare opportunity to rethink how their regional bus network feeds into the expanded rail service, and how it could amplify the impact of the extended rail line.
Redesigning 22 bus routes (10 all-day and 12 peak-only) to serve the new infrastructure required precision, speed, and above all—confidence that the changes would benefit riders. KCM needed clear answers to critical questions:
- Will our new network get people where they need to go—better and faster?
- Will it attract new riders?
- Will the investments translate into meaningful improvements in mobility?
With Remix Ridership Modeling, a new demand modeling tool in Remix that leverages journey planning app Citymapper’s real-world rider data to predict ridership, KCM incorporated faster, more flexible demand modeling into their planning workflow.
Learn how the team made sure their redesign was grounded in data and addressed real rider needs.
Empowering planners with demand data at their fingertips.
KCM knew rider experience was a critical part of their redesign, but found traditional ridership forecasting tools had fallen short—they were expensive, complex, and slow to set up. Moreover, data sources were static and quickly became dated—leaving KCM to question how riders really experienced their network in real time.
Ridership Modeling changed all of that. Now, demand modeling could be:
- At their fingertips: Built right into Remix’s planning interface, any planner—not just modeling experts—could run comprehensive scenario analyses as they made network decisions.
- Real time and hyperlocal: Combining Citymapper trip data from real riders, KCM’s own ridership records, and public sources like Census and LEHD gave KCM a hyper-localized view of their riders’ experiences using the network.
- Intuitive: Providing easy-to-understand predictions on travel time, ridership, modal shift, and transfers—complete with clear maps and visualizations helped the team visualize implications easily.
Because the ridership data is hyper-localized, KCM can see how their community interacts with the network. Unlike static, traditional demand sources, it stems from MaaS app Citymapper’s trip data, collected from millions of real journey planning decisions made by users every day. The data is then fused by a demand model developed by Via’s data science team that incorporates data from public datasets and KCM’s own ridership data to deliver a robust demand model that uncovered the patterns in their community other tools had missed.
For the first time, KCM’s planning team was able to evaluate multiple draft network proposals quickly and receive clear, stop-level predictions for ridership, wait times, walking distances, and mode shift potential—all through one intuitive, comprehensive interface.
Validate network decisions with data from real riders.
KCM first used Ridership Modeling during the service concept design phase of the South Link Connections project. The team had three clear goals: make it easier and faster to travel, improve access to jobs, and meet ridership needs.
Goal 1: Make it easier—and faster—for people to reach the new rail stations by reducing walk and travel times.
After making initial network changes, Ridership Modeling provided insights confirming the overall redesign proposal would reduce wait times while maintaining similar levels of ridership.
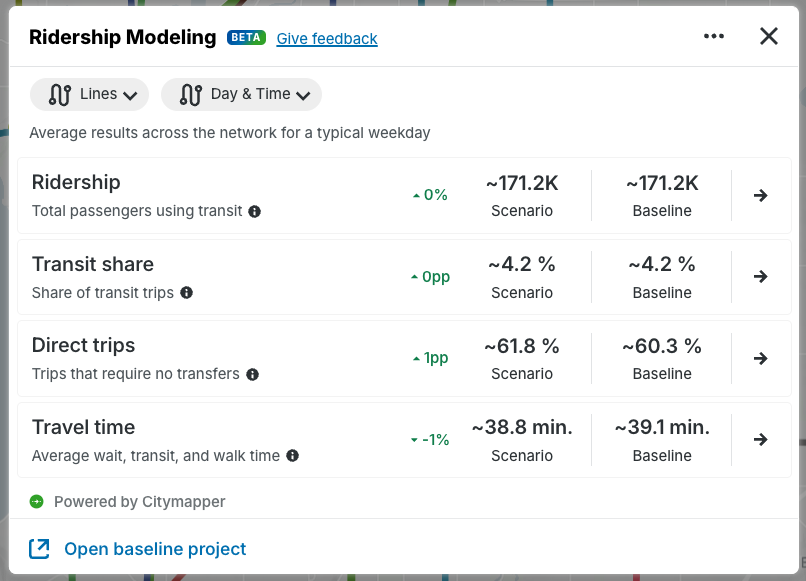
Ridership Modeling results for network changes demonstrate a decrease in average wait time.
An even more important takeaway was about travel times—a key metric KCM aimed to share with the public. This metric mostly improved across the project area located in South King County. Remix’s clear visualizations made it easy for the planning team to see where the new network outperformed the old one, helping build confidence in the changes.
.png?width=1277&height=832&name=kcm%20travel%20time%20reduction%20(1).png) Ridership Modeling shows areas (in blue) where travel time has been reduced due to network changes.
Ridership Modeling shows areas (in blue) where travel time has been reduced due to network changes.
“I really like this visual, it's very clear. This is where I got really excited—when I saw the dark blue in Federal Way, which is the location of our project and where we've made a lot of improvements” explained Gaughan.
Goal 2: Improve access to jobs in underserved areas.
The second redesign goal was to improve access to jobs in underserved areas. Ridership Modeling confirmed the importance of this initiative by surfacing data that confirmed KCMs initial hypotheses about transit deserts surrounding major employment centers:
“The Kent Industrial Valley is a major source of employment, including Amazon fulfillment warehouses. Currently, it does not have strong transit service, which is a known issue in our system confirmed by Remix Ridership Modeling. One of the project goals for South Link Connections is to provide better service to the people trying to get to work in this area.” Gaughan explained.
“The data matched my expectations; specifically regarding behavior around major employers and transit destinations. It's intuitively very clear.” Gaughan added.
Because the team was able to validate this important assumption, they could make decisions to better service these areas.
Goal 3: Ensure the network works not just in theory, but for real riders’ needs.
Ultimately, KCM’s goal was to provide better mobility to South King County by connecting their southern community to the extended light rail system.
The planning team was particularly excited when predictions for the traditionally underserved population in the South King County segment came in, which demonstrated ridership along key routes was modeled to increase in double digits as a result of the network changes.
.png?width=1284&height=382&name=KCM%20ridership%20increase%20selected%20lines%20(1).png) Ridership Modeling demonstrates an increase in ridership in South King County.
Ridership Modeling demonstrates an increase in ridership in South King County.
The results are a testament to the community need for the South Link Connections Project— the redesign of the bus network tapped into an unmet need for riders and is predicted to grow ridership.
Use ridership data to power consensus among stakeholders.
Beyond resounding validation of the new network plan, Ridership Modeling gave King County Metro something equally impactful: a way to bring stakeholders along throughout the process.
Routes 181, 182, 183, 187, 902 and 903 have been redesigned to connect to the new light rail stop in Federal Way. KCM needed to be able to show what the impact of the changes would actually look like for these routes. This where Ridership Modeling results for stop-level ridership (daily averages) came handy:
 Ridership Modeling shows predicted stop-level ridership changes compared to the current network (increases in blue) for the community in South King County.
Intuitive visuals—like map-based rider impact comparisons—made it easy to communicate how the redesign would affect the community in a way that stakeholders could easily understand. Whether the team is talking to decision-makers or community members, they could clearly show the "why" behind each choice and build trust and excitement along the way.
The bottom line.
For King County Metro, Ridership Modeling marked the first time demand modeling was not only possible—but practical. It was fast, intuitive, and grounded in how their people actually move. By blending Citymapper data with KCM’s ridership data and public datasets, Ridership Modeling helped KCM uncover new insights, confirm choices, communicate with stakeholders, and plan a more equitable and effective network for the future.
Want to learn more about Ridership Modeling? Get in touch below.
